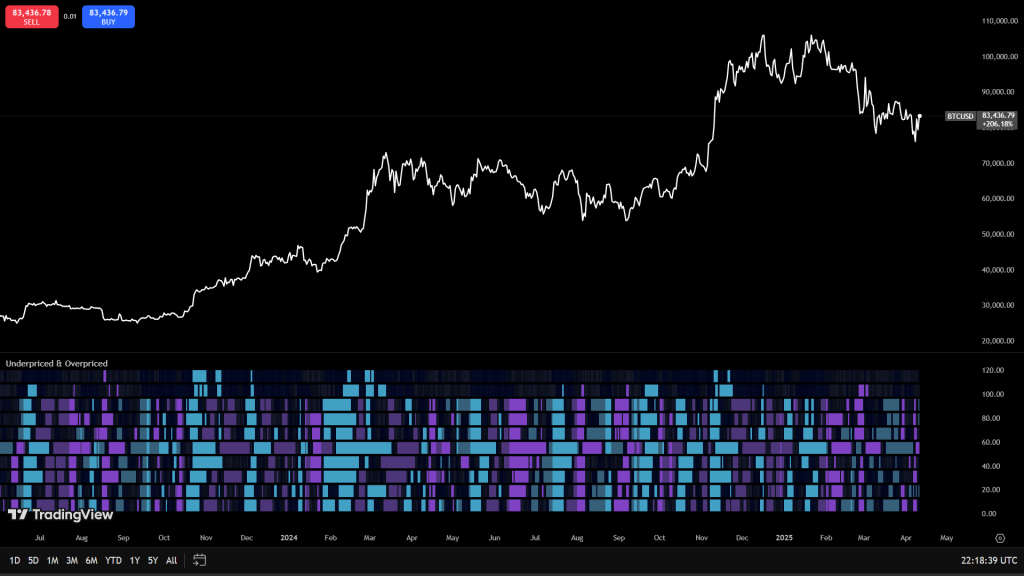
Underpriced & Overpriced Heatmap™
Predict OBOS. Visualize cycles.
The Enhanced OBOS Heatmap builds on our flagship framework by integrating 10 of the most reliable oscillators into a unified visual matrix — offering instant, high-resolution insight into market extremes.
But this isn’t just about identifying overbought and oversold conditions. By embedding a dynamic EMA-based baseline, the heatmap intelligently differentiates between four actionable zones:
Underpriced, Overpriced, Inflated, and Discounted.
This structure transforms the heatmap into a predictive surface — one that highlights trend exhaustion, potential reversals, and prime mean reversion setups. Traders can quickly assess trend depth, spot early divergences, and stay ahead of shifts in momentum without toggling between indicators or timeframes.
One screen. Four zones. Built-in precision.
The edge is in the structure.